Preparation of reports and business plans. Graphics
You can build any of the graphs (line, histogram or circle) literally on the fly. To do this, you need to do the following:
1. In any of the plans select the required range of values with the mouse cursor (only numbers)
2. Press the button of the corresponding graph (line, histogram or circle)
☛ Note that in order to build a "circle", you need to select at least two lines in at least one column, and in order to build a "line" graph, you need to select at least two columns in at least one line.
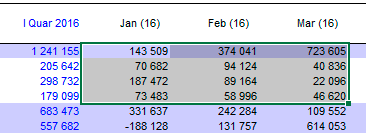
3. You can also select multiple ranges, for example, if you want to consider only the month values and skip the totals. Use the mouse cursor in combination with the Ctrl key to select individual ranges.
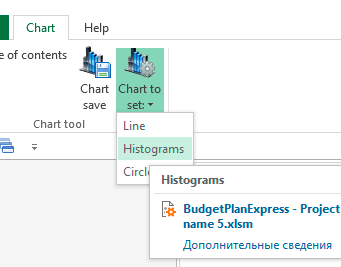
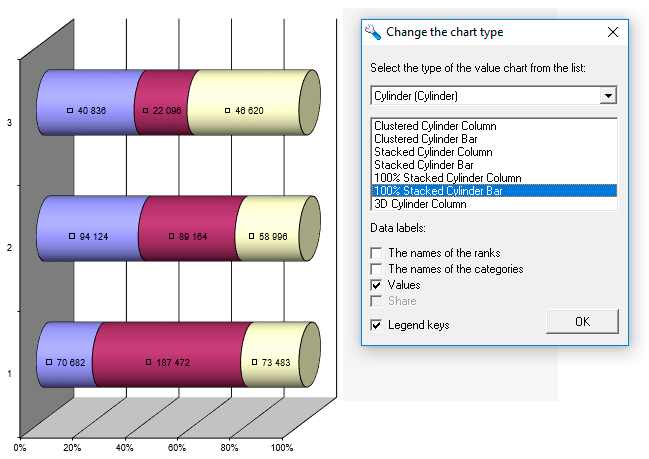
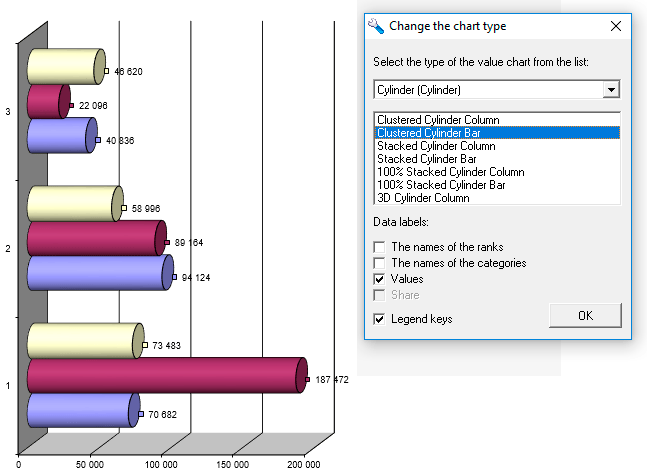
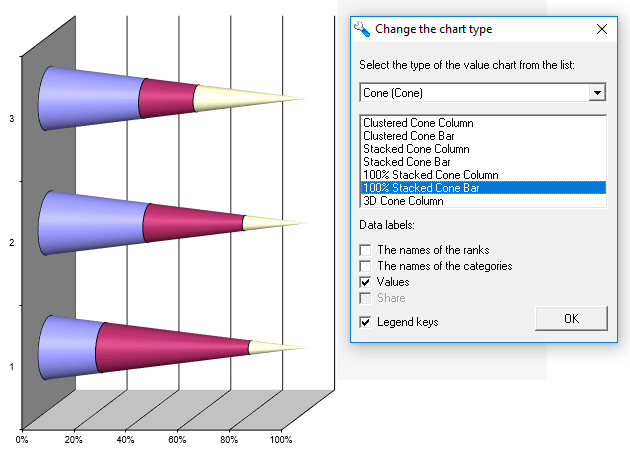
4. After you go to the chart page, here you can make additional settings - in the “settings” menu, select “line”, “histogram” or “circle”. Select any of the chart types from the list (more than 70 types are available). You can also customize data labels, category names, percentages, and more here.
5. To save the graphs click the "save" button, and save it in one of the formats (GIF or JPEG). When preparing a business plan in Word, insert your charts anywhere in the business plan ("insert" tab, "picture from file" button).
You can also build a graph by first exporting plans to Excel, and there you can build a graph of any complexity yourself.
Budget-Plan Express is a software product for preparing business plans and presentations in Word and Excel format - for small businesses and studies (students, MBI students, etc.) More ...
"Fast" graphics
Graphics are an important part of reports and business plans. Graphics are inserted into the text, or they accompany tables and announcements in presentations. Analytical graphics enhance the value of any business plan or analytical material. Graphics are pre-created and saved for later insertion into a text editor (Word), while preparing automated reports and business plans.
In "Budget-Plan Express" a simple and convenient user tool for building simple "quick" charts is created. To save the graphs created in Budget-Plan Express, two popular raster formats of graphic images are used: GIF (Graphics Interchange Format) and JPEG (Joint Photographic Experts Group). Saved graphs can be used to prepare business plans or presentations. The interface of the program contains settings of almost 70 standard graphs, which are conventionally divided into three categories, and are selected from the menu item: "Line", "Histogram" or "Pie Chart ".

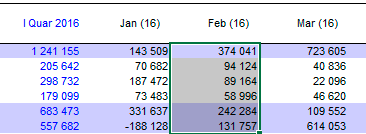
To build a chart, just select a fragment of the table, as shown in the figure,
and click the appropriate menu icon: "Line", "Histogram" or "Pie Chart".
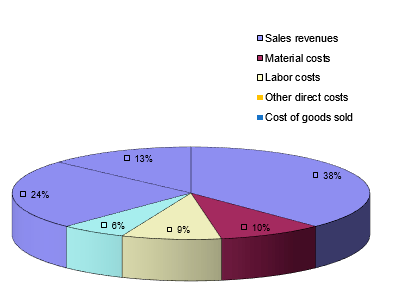
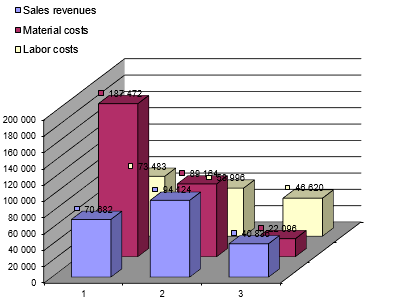
Pay attention! To call the "Pie Chart", the number of lines (names) must be more than one. Accordingly, the number of columns (periods) must be greater than one in order to trigger the Lines or Histograms chart.
How to change the graph?
To change the graph, call the corresponding graphic type (Line, Histogram or Pie Chart) from the menu item "Settings Chart". In the "Change Chart Type" settings, you can select the type of graph and configure the data parameters (names of rows and categories, values, etc.).
How to save the graph and return to the tables?
To save the graph, select the menu item "Save Graph", then, in the dialog box, select the path (by default, the "files" directory), specify the name and file type - one of the extensions (GIF or JPG), and click "Save". The saved graphic file can be inserted into Word reports, in PowerPoint, and so on.
To return to the table, click the "Back" arrow, as shown in the figure, or - the Alt + Left key combination ("left" arrow). Also, you can select from the drop-down menu list any of the tables.
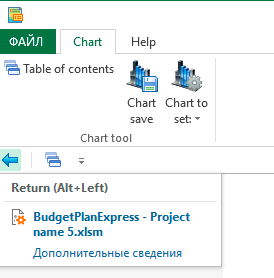
☛ Note that in some earlier versions of Excel (for example, in 2007), the Quick Access Toolbar may not display the navigation icons, in this case you can use the hot keys (Alt + Left) or return to the "Table Contents" menu item to return to the table.
