Trends. Forecasting trends. Practical planning
To quickly fill in string values, it is recommended to use the specially designed tool that allows you to automatically fill in a series with the given settings of the forecast trend. Trends are used for Forecasting planning prices, the description of inflation risks associated with the implementation of the business plan of the project.
Budget-Plan Express is a software product for preparing business plans and presentations in Word and Excel format.
Download and try the new version of the program (6.02). Details ...
☛ Note, table "Forecasting trends" is available for common edit and to import rows if they were designed in other programs or spreadsheets. Accounting planning interface and populate the rows used in the plan "fixed costs".
Planning forecast trend
Forecasting trends в Budget-Plan Express выполняют две основные функции:
- Trends are part of the calculation methodology for price fluctuations;
- Trends are used in reports when preparing business plans in Word: when you convert tables into one of the currencies, you use currency trends.
To call the planning form of the trend ("the trend to Build"), click (single click) left click active on the link, or F2.
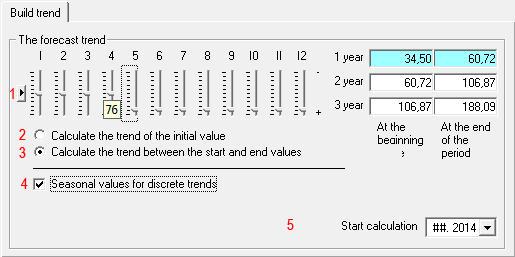
To plan values, enter the values at the beginning and the end of the year, then use the tools interface to configure settings for the trend calculation. After setting the settings, click the "Calculate" button and the row will be filled in according to the settings.
An example of planning a number of with regard to the forecasting of the trend:

 Interface tools:
- Default values . The value of all sliders (periods) equals zero.
- Calculate the trend from the initial value . The initial value is the starting point for calculating the trend. The subsequent values of the trend are calculated as the initial multiplied by the seasonality factor, without taking into account the seasonality factor in the first period:
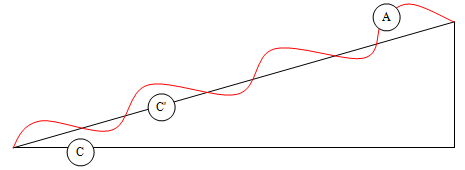
- Calculate the trend between the start and end values . Intermediate trend values are calculated as the moving average, multiplied by the seasonality factor:
- Seasonal values - for discrete trends . If the fluctuations in seasonality are "non-cyclic" (the "Seasonal values for discrete trends" check box is selected), the subsequent values of the sliders take the value of the current (editable), as shown in the figure:
- Calculation start date . The period from which the trend is filled.

-
Trend valuei = C1 + C1 × (Ai - A1)
Where:
Ai – values of seasonality in i period;
1 – values at the beginning of the period.

-
Trend valuei = Аi × С'i
Where:
Аi – values of seasonality in i period;
С'i – values of the moving average at i period;
Read more on moving averages see Moving Averages and Budget Series Adjustments in Budget-Plan Express.

In the example in 5 month is set to 76, the same value is corrected in subsequent periods.
Example filling a row with a view of the moodк
As the basis of forecasts, as a rule, expert ratings of various rating agencies, information from sites specializing in forecasting, and other sources are taken. In some cases these estimates are the boundaries of the projected risks.
Example. Fill in a number of projected prices for AI-95 gasoline for the period 2015-2017.Some forecasting agency gives the following forecast for gasoline prices of AI-95 (Rub.) For 2015, 2016 and 2017:
-
☛ As of the beginning of 2015 – 34,50 руб.
☛ As of the beginning of 2016 – 36,20 руб.
☛ As of the beginning of 2017 – 37,90 руб.
☛ At the end of 2017 – 40,50 руб.
- step. Enter the corresponding values in the data fields - at the beginning and end of each period, as shown in the figure:
- step. Select the option "Calculate the trend between the start and end values".
- step. Set the appropriate seasonality values (the flag "Seasonal values - for discrete trends" should be disabled).
- step. Click "Calculate".

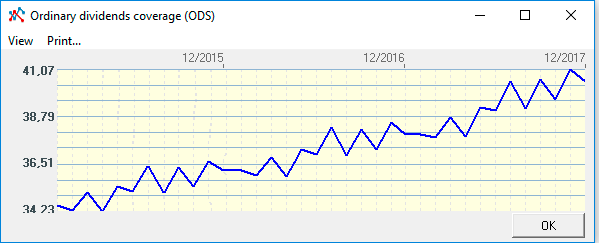
The result of the calculation is the "Forecast of gasoline prices of AI-95 brand" (36 months):

Import of forecasted trends and exchange rates
The import procedure is invoked from the main menu: Main menu → "Data → Import data" – follow the instructions.
Applied and recommended procedures and functions
- If you deleted some data by mistake or performed the action, causing damage to data, exit the program without saving: "Main menu → Project file → quit without saving".
- If you exit the program, save the changes: "Main menu → Project file → Save" (or Ctrl+S). Or use the program exit with saving.
- Periodically back up the data: "Main menu → Project file → Save and backup" or Ctrl+Shift+S. File project saved in the folder "backup", the project name will display date and time of saving. To restore the file, just copy it in system folder («BPlanExpress»).
- If you have several projects (or calculation options), create a template file and, starting a new project, open the template file where your settings or preliminary project calculations are saved, select the menu item: "Main menu → Project file → To create a new project". This will shorten the development time of projects. ☛ Note that a new project is created in the system folder ("BPlanExpress"), which opens by default.
- Complete the final calculation: "Main menu → Data → Calculate". Same - F9.
- Clear table (reset values): "Main menu → Data → Clear table".
- Delete the table (delete all data and settings of the table settings): "Main menu → Data → Delete table".
- Clear the string (reset value): "Context menu (right mouse button) → Clear line."
- Translit: "Main menu → Settings → Translit text tables". Select the translation language.
- Export: "Main menu → Reports → Export to Excel". In the same place - export to Word.
- Financial and investment analysis. Settings parameters of project performance indicators:"Main menu → Settings → Investment analysis".
- Quick graph: "Context menu (right mouse button) → Graph of a line." Before the call, place the cursor anywhere in the row with the desired data. See also «Preparation of reports and business plans. Graphics».
