Financial reports. Product report. Margin analysis and break-even analysis
The "product report" table shows the result of calculating income and expenses by marginal analysis for one selected product. Also, based on the calculated data, the break-even point is calculated and plotted for the selected period. The period can be a year, a quarter, or a specific month. The popularity of margin analysis, together with break-even analysis, in business planning is explained, on the one hand, by the simplicity of the algorithm for finding the break-even point, and on the other, by identifying risk boundaries. As you know, risk assessments are important components of any business plan.
Budget-Plan Express is a software product for preparing business plans and presentations in Word and Excel format, optimal for small businesses and studies (for students, graduate students, MBI students, etc.)
Build a financial model of your project or calculate loan financing on different terms! Try the new version of the program (6.02). Details ...
Algorithm for performing a break-even analysis
1. The break-even analysis is performed from the "product report" plan. To do this, you need to select the period for which the analysis will be performed.
2. In the main menu, select "reports → export to Excel → drillthrough reports".
3. In the form that opens, select the period for which the analysis will be performed and click OK, and the break-even analysis will be built in a new Excel workbook. A break-even table will be built in one tab, and a break-even chart in the other.
☛ Important! To perform a break-even analysis in the "product report" table, in the selected period, sales data (volume, price, cost), as well as variable fixed costs, must be presented. If there is not enough data in the table, for example, fixed costs are not indicated, the break-even analysis will not be performed.
Please note that in order for fixed costs to be displayed in the product report, these costs must be pre-allocated to products in the "fixed costs" table (see the Help topic "Fixed cost plan. Planning practice")
Also, see later in this section the item "Methodology for calculating the break-even analysis".
Margin analysis of cost and profit
Margin analysis - analysis of the ratio of sales volume (output), cost price and profit based on the forecast of the level of these values and other parameters. Margin analysis is performed by product - for each period and final periods (quarter, year).
All costs of the organization can be divided in relation to the volume of production into conditionally variable and conditionally fixed. Separation of costs into fixed and variable costs is traditionally used in direct costing systems (see Help "Cost accounting method in calculating the cost price").
The program generates a part of direct costs from already calculated plans (sales plan, procurement plan and regulatory costs). At the same time, it is important to understand that the program will not be able to determine another part of the costs for the selected product, if they (costs) are not previously posted to products. In other words, before you can perform the marginal analysis, you must post the fixed costs and the resource costs (from the Gantt chart) to specific products. This is very simple, in editing forms you only need to specify the percentage that will be attributed to a specific product (see Help topics "Distribution of costs in the production plan by products" and "Distribution of costs included in the fixed costs plan, by products"). It is this method of posting costs (indicating the percentage) that will allow you to perform a full margin analysis - for each product and in each period.
Performing a "product report" calculation
For the calculation of the "product report", as already mentioned, operational plans are used. To call the calculation procedure, you need to click on the active link, then select the desired product from the list, as shown in the figure, and click «OK»:
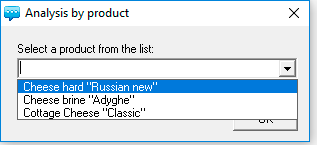
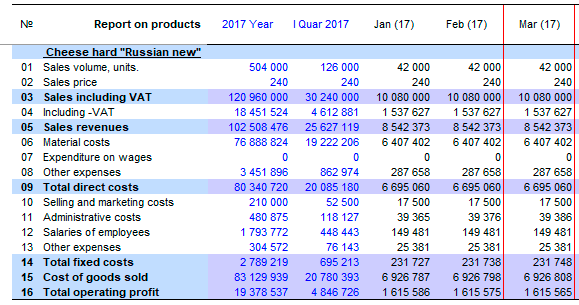
Table "report by products"
Structure and contents of the "report by products" table:
| № | Name | Input and output data |
| 01 | Sales units | Number of sold product units (table of sales planning → Sales plan) |
| 02 | Sales price | Sales price, including VAT ( Sales planning table → Sales plan) |
| 03 | Proceeds from sales | Sales revenue, VAT included ( Sales planning table → Sales plan ) |
| 04 | Including -NDS | VAT included in the product ( Sales planning table → Sales plan ) |
| 05 | Revenues from sales | Net sales revenue (excluding VAT) from sales for the period ( Sales planning table → Sales plan ) |
| 06 | Material costs | Regulatory costs ( Procurement plan and regulatory costs → Calculation of flow ) + Cost of resources or stages ( Cost plan for the implementation of production stages ) |
| 07 | Direct labor costs | Standard costs ( Procurement plan and regulatory costs ) + Cost of resources or stages ( Cost plan for the implementation of production stages ) |
| 08 | Other costs | Regulatory costs ( Procurement plan and regulatory costs ) + Cost of resources or stages ( Cost plan for the implementation of production stages ) |
| 09 | Total variable costs | = [06] + [07] + [08] |
| 10 | Business Costs | Calculation of fixed costs ( Plan fixed costs ) |
| 11 | Administrative Expenses | Calculation of fixed costs ( Plan fixed costs ) |
| 12 | Employee Salary | Wages [fixed costs] ( Plan fixed costs ) |
| 13 | Other costs | Calculation of fixed costs ( Plan fixed costs ) |
| 14 | Total fixed costs | = [10] + [11] + [12] + [13] |
| 15 | Cost of Product | = [09] + [14] |
| 16 | Operating profit (marginal) | = [05] - [15] |
A fragment of a calculation result:
Break-even analysis

The program will create an Excel file, which will build breakeven table and graph break-even point for the selected period. The procedure of break-even analysis is invoked from the main menu: "Main menu → Reports → Export to Excel → Detailed reports". Then on the screen a window will appear in which you need to select the time interval: year, quarter or specific month.
 The procedure of break-even analysis is called from a menu item "Detailed reports", available if open table "report by products".
Example. Example of calculation of the breakeven point for the selected period.
- step. Go to the page "Report product" using the menu navigation (arrow or list of plans).
- step. Will calculate expenses and income by product: click the mouse cursor on the active link, select the product from the list and click "OK".
- step. Call the procedure for the calculation of break-even analysis: "Main menu → Reports → Export to Excel → Detailed reports".
- step. Select period from the list, as shown in the figure, and press "OK":
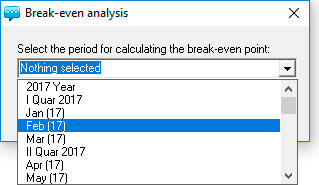
As a result, the program created a file of an instance of Excel with two pages: the "Break-even chart" (see figure) and the "breakeven table".
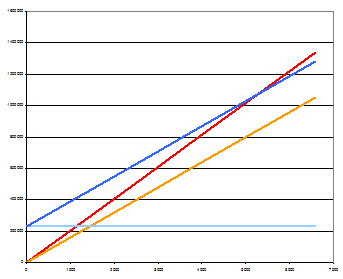
Break-even chart:
Switch between workbooks Excel keyboard
☛ Use the keyboard to switch between Excel books (Ctrl + Tab), if during the process of exporting data or opening an Excel file, the "Budget-Plan Express" project window became unavailable.
When you perform the export to Excel, a new instance of the Excel workbook is created, that is, the file should open in a new window. However, in some installations or in legacy versions of Excel (for example, in 2010) to open files in new windows, you must change the settings in the Windows registry. In most cases, this drawback is considered a flaw in the old (Excel 2010 and earlier) versions.
Registry settings will not be considered here, you can find relevant information in free sources. To display the desired file, you can simply switch between Excel books using the keyboard:
- Ctrl + Tab or Ctrl + F6 - switch between active books in the direct order
- Ctrl + Shift + Tab or Ctrl + Shift + F6 - switch between all active books in reverse order
The calculation procedure for the implementation of "break-even analysis"
breakeven Analysis (Break-Even Analysis) is a popular method, which allows the company to decide how much you want to produce and sell products to fully cover its fixed and variable costs. Periodical break-even analysis enables the company to make decisions that allow to maintain a certain level of profitability and justify opportunities for sustainable business expansion. Break-even analysis involves the use of a simple set of key performance indicators of the company.
At the initial stage, you need to accurately determine the variables and fixed costs. To do this, the program uses special interfaces for the distribution of costs for products: for variable costs (the "costs for the implementation of production stages" plan), for fixed costs (the "fixed costs" plan).
To create a break-even schedule, a data table (breakeven) must first be created. To create a break-even table, you first need to calculate the breakeven point by the formula:
-
Breakeven point = Constant expenses for the whole period / Marginal profit per unit
Where period calculate the break-even point can be year, quarter or month .
Marginal profit (Marginal Revenue) per unit is calculated by the formula:
Marginal profit per unit = P - VC
Where:
P - average weighted net price (without VAT) in the period is calculated by dividing net earnings for the period by the number of sales over the period.
VC - variable costs per unit of output, calculated – as the variable costs for the whole period (year, quarter or month) divided by the number of sales in period.
Example. We use data from the previous example and calculate the breakeven point in January 2015, for the product Cheese "Russian".
-
The table shows the row indexes and data that
- step. Calculate the weighted average net price (excluding VAT) for the period: [05] / [01] = 8,542,373 / 42,000 = 203.39
- step. Calculate the variable costs per unit of output for the period: [09] / [01] = 6,695,060 / 42,000 = 159.41
- step. Calculate the marginal profit per unit of output: the weighted average net price (step 1) - Variable costs per unit (step 2) = 203.39 - 159.41 = 44.98
- step. Finally, we calculate the breakeven point: [14] / margin profit per unit (step 3) = 231 727 / 44.98 = 5 268.92 ≈ 5 269
are necessary for calculating the break-even point:
| № | Article | Data |
| [01] | Sales volume, units. | 42 000 |
| [05] | Revenue from sales (without VAT) | 8 542 373 |
| [09] | Total variable costs | 6 695 060 |
| [14] | Total fixed costs | 231 727 |
To graph, we need a table where costs are recognized in proportion to the scale of the break-even point: let BE - break-even point, then in the first column "sales units" should be set to 1/4 × BE, the second - 2/4 × BE, the third - 3/4 × BE, the fourth - 4/4 × BE = BE, the fifth - 5/4 × BE. Also, proportionately calculated for the string "sales revenue" and "variable expenses": sales = n × BE × The average weighted price (step 1), variable costs = n × BE × variable costs per unit (step 2).
Page fragment "breakeven table":

After the break-even table is ready, the program will plot the graph. The type of graph – line, where the values of sales volume (including the breakeven point) are displayed in the horizontal scale of the timeline.
A fragment of the page "Break-even chart":
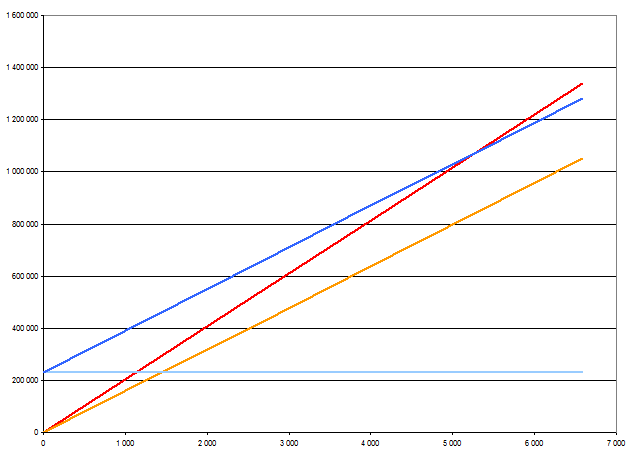
The scale of "sums" is located vertically, horizontally - the scale of "sales units". The break-even point is the point of intersection of sales revenue and total costs (respectively, red and blue lines). [Total costs] = [variables] + [fixed costs] (respectively, yellow and blue lines). The projection of the breakeven point on the "sums" scale shows the sales revenue at which the payback is zero. The projection of the break-even point on the "quantity" scale shows the sales volume at which the payback is zero. Values above the break-even point, between revenue lines and total costs, are in the profit zone.
Applied and recommended procedures and functions
- If you deleted some data by mistake or performed the action, causing damage to data, exit the program without saving: "Main menu → Project file → quit without saving".
- If you exit the program, save the changes: "Main menu → Project file → Save" (or Ctrl+S). Or use the program exit with saving.
- Periodically back up the data: "Main menu → Project file → Save and backup" or Ctrl+Shift+S. File project saved in the folder "backup", the project name will display date and time of saving. To restore the file, just copy it in system folder («BPlanExpress»).
- If you have several projects (or calculation options), create a template file and, starting a new project, open the template file where your settings or preliminary project calculations are saved, select the menu item: "Main menu → Project file → To create a new project". This will shorten the development time of projects. ☛ Note that a new project is created in the system folder ("BPlanExpress"), which opens by default.
- Complete the final calculation: "Main menu → Data → Calculate". Same - F9.
- Clear table (reset values): "Main menu → Data → Clear table".
- Delete the table (delete all data and settings of the table settings): "Main menu → Data → Delete table".
- Clear the string (reset value): "Context menu (right mouse button) → Clear line."
- Translit: "Main menu → Settings → Translit text tables". Select the translation language.
- Export: "Main menu → Reports → Export to Excel". In the same place - export to Word.
- Financial and investment analysis. Settings parameters of project performance indicators:"Main menu → Settings → Investment analysis".
- Quick graph: "Context menu (right mouse button) → Graph of a line." Before the call, place the cursor anywhere in the row with the desired data. See also «Preparation of reports and business plans. Graphics».
