Sales plan. Form elements and planning tools
Calling the form «Sales planning»
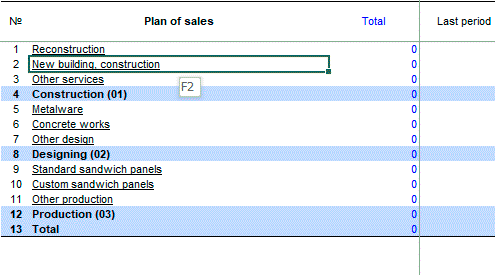
Go to the "Sales plan" page, select the product and open form of editing "Sales Planning":


Budget-Plan Express is a software product for preparing business plans and presentations in Word and Excel format, optimal for small businesses and studies (for students, graduate students, MBI students, etc.)
Build a financial model of your project, calculate the options for sales plans yourself! Try the new version of the program (6.02). Details ...
Tools for editing "Sales Planning Tables"

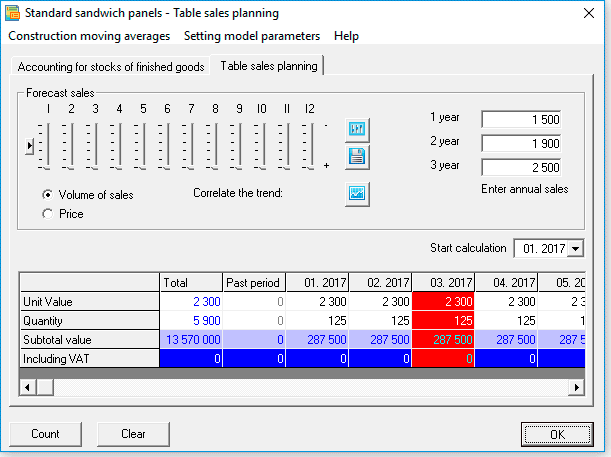
After opening the form, the "Sales Planning Table" tab is activated:
1. Title
2. Tab
3. Frame
 Elements of a frame are applied only in case of using the planning method "by annual values" and, as a rule, in cyclic models (see the next section "Methods of planning").
4. Slider

You can set the values of the slider in 2 ways:
1 way. Grab and move the slider with the mouse.
Method 2: Use the arrow keys. First, activate the slider (click on it with the mouse), then move the mouse cursor over the slider so that a pop-up hint appears (as shown in the picture).
5. Fields
 Optional: Applicable only if you use the planning method "by annual values".
6. Options (switches)
 Optional: only used in the case of using the method of planning the "annual value".
7. Calculation start period
☛ Note that in "General settings" you can to forbid to edit past period.
8. Built-in table
To further edit the table, you can use the following tools:
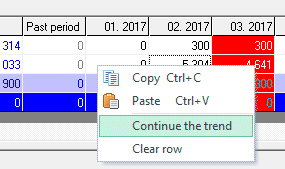
8.1 Context menu edit data:

Call up the menu right click of the active cell is being edited (for non-editable cells menu not available!). Procedure "to continue the trend" and "empty string" run, starting with the active cell (period), until the end of the series.

- Insert a value (number) from the clipboard (clipboard).
- Insert a trend (number series) into a string starting with the selected (active) cell. Of course, this action is only possible if you exported from a named range.
8.2 Construct a line graph:

You can call up the "line graph" menu with the right mouse button, but only from the selected row (to select a line, left-click on the name).
8.3 Entering (editing) from the keyboard:

To enter (edit) data, perform one of the following:
- Press "Enter"
- Double-click.
- Entering numbers from the keyboard (the old data is deleted)
Exit after editing:
- Press "Enter"
- Tab key
- Click the mouse - on any element of the form.
- The "Esc" key is the exit without saving .
8.4 Entering a formula into a cell:

To call the formula, enter the "=" sign from the keyboard while in the active and accessible cell. To calculate and then enter the result in a cell, the formula uses mathematical operations signs:
- = (*) - multiplication;
- = (/) - division;
- = (+) - summation;
- = (-) - subtraction
- = (^) - exponentiation.
All the above procedures are designed as standard interfaces for all built-in tables.
9. Calculate button
 When you click "Calculate", you are prompted to select one of the options:
-
1. Calculate sales plan -by annual values. The result is displayed in the table (in the "built-in" table).
2. Calculate the sales plan -Interpolation by trends. The result is displayed in the table (in the "built-in" table).
3. Final calculation. The calculation result is displayed in the table "sales Plan".
10. Clear button
 When you click "Clear", the data will be "cleared". There is a choice of one of the options:
-
1. Sales planning table.
2. The plan of the leftovers of finished goods.
3. Summary tables.
11. Menu - for adjustment of price trends
 Menu item "Forecasts":
| Name | Value |
| The forecast of the price on the specified interval ... | Price forecast - in accordance with the settings of models |
| Smoothing a number of prices ... | Smoothing of a number of prices - in accordance with the settings of models |
| Save table | (1) to save values or (2) to restore the previous values |
 Menu item "Trend calculation parameters":
| Name | Value |
| Choice of model moving average | Type: SMA, WMA or EMA |
| Smoothing interval | 3 - 6 |
| Forecasting interval | 1 - 3 |
| Smoothing Constant | 0,1 - 1 |
