Standard interfaces. Built-in table
Table (Grid), built-in forms
☛ Note that all plans that appear in the Excel table are referred to in this manual as "tables" or simply "plans" (see the previous section - "Formats of tables of budget plans"). In this section we will talk about tables built into data editing forms, in this manual they are called "embedded tables".
Budget-Plan Express is a software product for preparing business plans and presentations in Word and Excel format, optimal for small businesses and studies (for students, graduate students, MBI students, etc.)
Build a financial model of your project or calculate loan financing on different terms! Try the new version of the program (6.02). Details ...
The built-in tables that are used in the data editing forms are developed according to the standard standard rules, which include:
- Standard time scale (38 periods)
- Standard color formats
- Context menu (for trend editing)
- Context menu (for calling a graphic editor)
- Editing formulas
- Auto-formatted line width
- Working with standard procedures
- Edit cells
1. Standard time scale
The standard time scale displays 36 main periods (months) and two additional periods - "past" and "future". Also, the directive period is highlighted with red vertical lines or with a red background.
2. Color formats
3. Editing tools
To work with data tables, you can use the following tools:
-
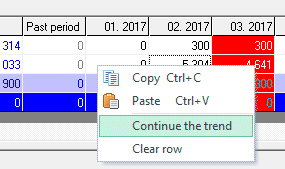
3.1 Context menu for editing data and trends:
- Insert data (number) in the cell;
- Insert a trend (numerical values) in a row, starting with the selected active cell (if you exported from a named range).
- Press "Enter"
- Double-click
- Enter numbers from the keys (in this case old data will be deleted )
- Press "Enter"
- Press "Tab"
- Click with the mouse - on any form element
- Esc key - exit without saving
- = (*) - multiplication
- = (/) - division
- = (+) - addition
- = (-) - subtraction
- = (^) - exponentiation or root (square root = n ^ 0.5 )

To access the menu, use the right mouse button while in the active cell in the table (not available for non-editable cells!).
The procedures "continue trend" and "clear the line" are performed starting from the active cell (the selected period), and to the end of the numerical series.

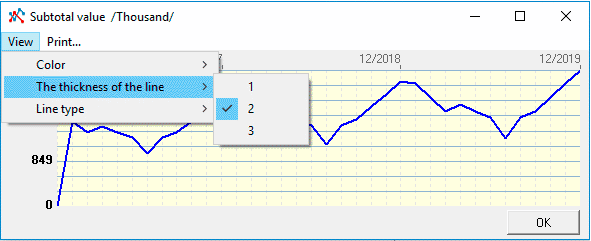
3.2 Construct a line graph:

To call the chart, select the row (click on the name), then right-click on the menu and select the line graph.

3.3 Enter (edit) data:

To enter data in the active (editable) the cell will do one of the following:
Exit after editing:
3.4 enter the formula in cell:

Challenge formula - enter with arrow sign "=" - function is available only for editable and active cell.
To calculate and then enter the result in a cell, the following comparison operators are available in the formula:
After the "=" sign, dial numbers and characters without a space.
3.5 Formats of numbers:
For some strings, you can specify in the settings the number of digits after the decimal point: "Main menu → Settings → Formats of numbers". Additional length of numbers valid for prices and quantities (reserves):
Also, in some rows: in the adjustment table, in the values of PAD and others, negative numbers are allowed. To enter a negative number, you must first enter a number, only then put the "-" sign in front of it:
3.6 Keyboard shortcuts:
Tables use the following hot keys, for example - in the table "assets", when pressing "Ins", is calculated and added (in the box) VAT.
For more information, see «Standard interfaces. Assigning hotkeys.
