Start planning: the first project
We wish you success!»
Team "Strategic-Line".
Practical course of video lessons (12 lessons on business planning practice) will help you to master the tools of the program for several hours and begin practical planning.
☛ Company launched a non-commercial Internet project involving educational institutions. The essence of the project is the transfer for non-commercial use of the Partner’s Internet license to students, graduate students, MBI students, etc.
Also, it is recommended to use the materials and examples contained in online help.
Planning objectives and typology of budget plans
Financial planning always has several objectives and not only financial goals, but the primary objective of financial planning is to generate three reports: a profit and loss statement, a cash flow statement, and a balance sheet. It is on the basis of these three tables that further financial and investment analysis will be built. In the classical typology of budgets, three types of budgets are distinguished:
- operating budgets
- financial budgets
- special budgets.
Operating budgets represent the budgets of the lower level, upon which to build financial and other budgets. A typology of budget plans, see "the structure of the plans "Budget-Plan Express"".
General algorithm for calculating a business plan
At the first stage, operational plans are built. Operational plans — sales, costs, settlements with creditors, etc. — are the basis of the structure of the future business plan. Therefore, until the operational plans are completed, it makes no sense to select schemes and financing options (financial and investment plans).
There are some features that need to be taken into account when preparing operational plans that you should know if you are going to prepare business plans yourself. For example, when planning in cyclical projects, sales are first planned (money receipts, receivables) and only then the cost part of the business plan. But in discrete (non-cyclic) projects it is construction, for example, consulting, the production of complex single products - in this case, the opposite is true. First, the costs are described (usually in the Gantt Chart), for example, the construction stages in the Gantt Chart, and then the sales options are planned.
So, the next step of the planning algorithm when preparing a business plan is a preliminary calculation of operational plans, first estimates of the effectiveness (operational efficiency) of the project.
The first stage can be repeated several times, it is important to find the most effective option (or - options) of operational plans.
The next step is the selection of a financing scheme. At this stage, it is necessary not only to choose the best option (options) for a financial solution, but also to eliminate cash shortages in all periods, as well as to eliminate possible cash gaps - with the help of various loan products (their options), leasing, investment, etc. Simply put, the final Cash Flowy line (cash) should not be negative, otherwise the program will not allow you to calculate the integral indicators of the project.
And only then are discounted project performance indicators (integrated indicators) calculated. And of course, the effectiveness of the project depends not only on operating activities, but also on an effective financial plan.
Approximately, such a sequence of steps, such a general algorithm is used in the preparation of business plans.
Information space. Preparation and structure of data for use in business plans
In some cases, planning can be seen as part of the management of a company – as a tool of decision-making and risk management. In this case, the data analysis results and scenarios are considered as part of the information space.
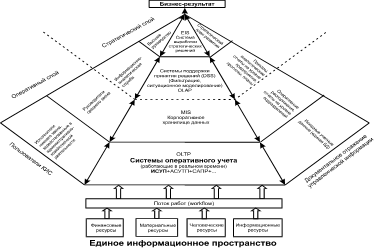
The input data structure used for the business planning, should also be carefully designed. Ie, before you develop a business plan it is advisable to structure the data so that they show the analytical cut, which would fit into a single information space (see figure). Typically, the data structure reflects the strategy of the company.
Analytical data are grouped data by product group, by Department, by vendor, by customer, etc of the group must fully meet the criteria for OLAP analysis (ON-LINE ANALYTICAL PROCESSING) if you used the OLAP-analysis.
If the analytical cut contains more than 15-20 items, such data are difficult to analyze. In this case, the grouping of data, and then analyzed the number of elements is reduced and, as a rule, does not exceed a reasonable amount (15-20 items).
|
Example of not grouped data: 
|
Example of grouped data: 
|
These data are convenient for graphical presentation and analytical reading. They reflect the purpose of the analysis, as are the analytical sections that shows, for instance, activities of partners or groups of products.

Use the Pareto principle when grouping data, paying attention to the actual data, and referring to "other data" non-priority data. The Pareto principle, e.g. for sales planning can be formulated as: "80 percent of sales bring 20 percent of the products".
Thus, we can formulate the following requirements for input to business plans:
- The degree of detailing of data in business plans should not be compared to an accounting, warehouse or ERP system.
- The analytical slice must contain no more than 15-20 elements.
- Group data - by product group, by department, by vendor, by customer, and so on
- Use the Pareto law, paying attention to current data, and referring to "other data" non-priority data.
- A carefully designed data structure will significantly reduce the time of preparation of the business plan and improve the quality of the analysis.
The program takes into account the limitations of the data required for the purposes of analysis to create business plans.
☛ When creating directories, for example, "product directory" (user tables for operational plans), a limit is set - no more than 30 elements of the directory.
At the same time, a well-thought-out data structure significantly reduces the time for preparing a business plan and improves the quality of the analysis.
Preparation planning
Creating a file with project settings
☛ A template file is the same project file, with frequently used parameters (year of start, tax base, etc.).
Each time, to create a new project file, you first open the template file, and select the menu item "Create a new project", come up with a short name (in English): "Main menu → Project file → To create a new project (clone of the current file) → In the dialog box have to specify the new file name", after which the name of the new project appears in the header of the file. If you need to create a new project again, again, use this (or another) template file.
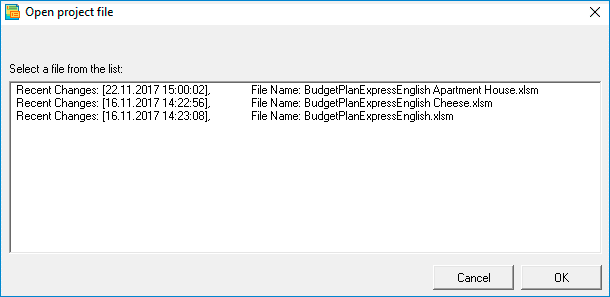
To run the program, run the application BPlanExpress.exe. Select a project or template file from the list. If you start the program for the first time, perhaps in the file list you have a single starting project - "BudgetPlanExpress".
![Icon of application program [BPlanExpress.exe] create a settings file project settings](img.files/help-005-program-logotype.gif)
Setting up a template file for projects
In the General settings, set the start year of the project implementation (month of planning not specified, it can be any month of the project). Set the other options – accounting, taxes, etc. (see section General settings). After the installation of the project in General settings, set the the beginning of a new accounting period in all tables of the plans: Main menu → Setup periods → The new accounting period. Also, in "General settings" in the "company (draft)" enter the full name of the project.
☛ Tip. If it is necessary to calculate different variants of one project (option "A", "B", "C" ...), also using the menu item "Create a new project", for example:
- Construction of frame houses - a project involving investor and credit resources
- Construction of frame houses - 50% equity participation, attracting a partner for preferential mortgage lending etc.
![A press [Settings] General settings - taxes, amortization, financial and investment analysis. Financial planning and analysis, Budget Plan Express for Windows](img.files/help-031-main-setup-form-english.gif)
See details sections «Preparation for planning. Setting the "time" scale» и «General settings. General data».
Beginning of work
So. Launch the program (BPlanExpress.exe) and select your project from the list. The list shows the names of the project files and information about them: the date of the last change, as well as the name of the file, in the information field - “project name” and “year of the beginning of planning”.
☛ Note that the program itself will add the mandatory prefix to the name of your file: «BudgetPlanExpress».
Preparation of directories and operational plans
- Directory of Products;
- Directory of "materials and standard costs" (possibly, directory will not be needed, for example, in a construction project);
- Directory of "resources and production stages" for editing the production plan (only for discrete projects, for example - in a construction project);
- Directory of fixed Cost.


| Directories | Table |
| Directory of Products | Sales plan |
| Directory of Materials and Standard Costs | Procurement plan and regulatory costs |
| Directory of Resources and Production Steps | Plan production costs |
| Directory of fixed Cost | Plan fixed costs |
How to create or import a directory, create a suitable operational plan, see "Preparation for planning. Reference".
Translit

When preparing business plans, the texts of the tables can also be translated into any other foreign ("user") language. This can be relevant, for example, if a partner of the company prefers to use reporting in their own language.

See details section «Preparation for planning. Translit».
Practical planning. The first project
Data preparation
☛ Note that the detailed planning horizon in the program is designed for 36 months. As a rule, the vast majority of projects are planned in the horizon up to 3 years (36 months). However, to calculate the project payback and other integral indicators, the calculation period can be extended to 15 years (180 months).
Before starting planning in the program, write a simple TA (technical assignment) - which will reflect the main parameters of the project - for products, payments, supplies, etc.
Products:
- the average price or the price at the beginning of the year
- risks affecting the change,
- forecast prices from a published expert sources, or expert evaluation price ranges at the beginning and end of each year (forecast for 3 years),
- annual sales (cyclic production)
- the seasonality of sales (cyclic production)
- the schedule of sales (discrete industries, such as construction project)
- recommended stock of finished goods (for the month).
Payment:
- beginning of period sales
- sales (sales conditions for different categories of customers)
- terms of installment payments (for various customer groups).
Delivery:
- the average price or the price at the beginning of the year
- risks affecting the change,
- forecast prices from a published expert sources, or expert evaluation price ranges at the beginning and end of each year (forecast for 3 years),
- consumption per unit of production,
- recommended stock of parts (per month)
- schedule of purchases or frequency of purchases (monthly, quarterly, semiannually, etc.)
Production plan:
If your project is a non-cyclic (discrete) production, for example, a construction or other project, prepare a table of stages (no more than 40 stages) for the Gantt chart. The Gantt chart (production plan) can be created in the "Budget-Plan Express" (recommended) or imported from MS Project (see "Exporting and Importing a Gantt chart - Exchange with MS Project").
Initial balance
Before starting the planning, if necessary, you can update the data in the table "Initial and updated balances". This can be data on funds in the company's accounts, information about assets, debts and other information:
![Initial and updated balances In the table [Initial and updated balances] you can add information about the funds in company accounts, information on assets, debts and other information](img.files/help-005-work-with-program-updated-balances-english.gif)
See details section «Financial reports. Balance sheet».
☛ Note, information about assets acquired before the beginning of the project (in previous periods), can also be added in the form of "Planning and accounting of assets" (see "Planning and accounting of fixed assets and other assets").
Sales planning
When planning operating budgets for cyclical and discrete (discrete model) production use absolutely different methodological approaches. This applies to the sales plan.
If you have cyclic production, start planning with the "sales plan" and "plan of receipt of money." When implementing a discrete project (e.g., construction project), it is recommended to start with the Gantt chart. Regardless of production restrictions, as a rule, the budget begins to be formed from the revenue side, and its structure depends on how the cash flow of receipts will be generated.
For sustainable development, the company must generate a continuous cash flow and forecast the risks associated with unsustainable revenues and current costs - especially at the start of the project.
In General, sales planning incorporates: planning for each product, prices, quantity adjustments (factors of seasonality, forecasting trends, etc.), tax planning and insurance reserve (cyclic production). See the "the concept of planning".
Example. Consider a simple example of planning a cyclical sales plan for a contingent product. Suppose, according to expert estimates, that the marketing department has prepared data for sales planning: a table of seasonality factors of sales (based on the results of previous years' observations), a forecast of prices and probabilistic estimates of annual sales volumes of the product N:
- for 1 year to 10 000 units
- to 2 years – 12 000 units,
- for 3 years – 15,000 units.
Table shows the seasonal factors of demand (sales), in percent:
| Months | 1 | 2 | 3 | 4 | 5 | 6 | 7 | 8 | 9 | 10 | 11 | 12 |
| Sales, % | 100 | 90 | 80 | 80 | 60 | 40 | 40 | 40 | 60 | 70 | 80 | 90 |
As can be seen from the table that maximum sales are during the winter months, minimum in summer. When planning sales, you always need to consider probabilistic seasonal cycles predicted by taking into account observations of past and current changes in market conditions.
In addition, it is assumed that the first 3 months the company will be able to realize no more than 50% of the planned volume of sales, the next 2 months – not more than 70%, then 100% of the target sales.
The prices for the product N will be considered with the VAT recorded. Let the initial price of the product 100. Suppose that every six months (in the 1st and 6th months) the price will increase by 5%
To plan the sales of product N, in the form of planning, follow these steps:- step. For planning in sales, you need to set the switch option – "sales". Enter in the appropriate fields annual sales: 10 000, 12 000, 15 000 (for 1, 2 and 3 years).
- step. Install and save the seasonal factors (table). For accurate seasonal values use the keys "arrow".
- step. For the price planning select the appropriate option – "price". Enter prices at the beginning of the year: 100, 110 and 121 (1, 2, and 3 years).
- step. Install and save the change by 5% starting in 6 months. Please note, when installing the seasonal price values, 7-12 (subsequent) months, the values will set automatically. For accurate seasonal values use the keys "arrow".
- step. Perform the calculation of "annual value", as shown:
- step. Using the formula (=number-n%), reduce the volume of sales in the first 3 months – 50%, the next two for 30%, as shown in the figure below:
- step. Finally, perform a final calculation of sales plan: Main menu → Data → Calculate → To set the flag "sales plan". Also the F9 → Set flag "sales plan".


How to plan sales, see «The sales plan. Practical planning»
Table of the result of calculation of the "sales plan" for the product N:
| Months | 1 | 2 | 3 | 4 | 5 | 6 | 7 | 8 | 9 | 10 | 11 | 12 |
| 1 year | 60 300 | 54 200 | 48 200 | 67 500 | 50 600 | 50 610 | 50 610 | 50 610 | 75 915 | 88 515 | 101 220 | 113 820 |
| 2 year | 159 060 | 143 110 | 127 270 | 127 270 | 95 370 | 67 048 | 67 048 | 67 048 | 100 572 | 117 392 | 134 212 | 151 032 |
| 3 year | 216 840 | 195 240 | 173 520 | 173 520 | 130 080 | 91 098 | 91 098 | 91 098 | 136 584 | 159 390 | 182 196 | 204 876 |
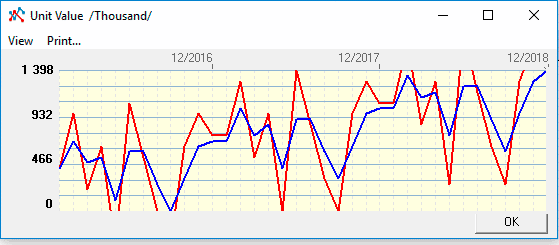
Planning tools sales Budget-Plan Express includes additional features and adjustments of price forecasting – see sections "correct plans with the use of moving averages" and "the sales Plan. Models of moving averages".
The chart in the Budget Plan Express. Example of using smoothing method
the short-term fluctuations:
 In discrete projects (e.g., construction) sales planning much easier than in cyclic models, and many analytical tools for planning, most likely, is not necessary.
Accents of planning in discrete projects are shifted more towards the organization of efficient processes - the segmentation of sales channels, the evaluation of direct sales and partner activities, synchronization in time, etc. That is, here the planning tasks lie more in the CRM plane (working with clients) , rather than in the plane of mathematical modeling of sales.
☛ Note that in almost all discrete projects, it is almost always important to plan the receipt of money and receivables, often in them the same product can be represented by several products (differentiation of the product by payment, sales channels, etc.). For example, the product "one-bedroom apartment" can represent three different products - "One-room apartment (100% prepayment)", "One-room apartment (installments 12 months)" and "One-room apartment (with equity participation)."
The use of "payment schemes" in planning the receipt of money and receivables
The following plans, after the "sales plan" - plans for "receipt of money" and "receivables".
From the "money receipt plan" you can call the "receivables planning" editing form, where you create and edit payment plans in the "setting payment parameters" tab. In another tab, you need to "link" the schema to the product (or products). After that, the program will generate cash flows for this product, in accordance with the settings - in the "receipt of money" and "receivables" plans.
"Payment plans" is a simple and effective tool, created in "Budget-Plan Express", to automate the process of cash flow planning and control over deferred payments.
All deferred payments, when calculating the project, fall into the group of accounts receivable risks - in the "Plan receivables". Unlike accounting, where not all deferred payments are referred to receivables, in business planning are all risks associated with any deferred payments for more than one month.
With the help of payment schemes it is possible to describe installments of accrued payments - up to 12 months. Payment plans facilitate the process of automation of cash flow planning and are created if the company has standard products that are paid in installments. For example, the company expects a standard product worth 100,000 with a 50% prepayment and a grace period - followed by equal payments within 5 months.
Payment schedule - a product worth 100,000 with a 50% prepayment:| Months | 1 | 2 | 3 | 4 | 5 | 6 |
| Payments | 50 000 | 10 000 | 10 000 | 10 000 | 10 000 | 10 000 |
| The percentage listed in the payment scheme | 50% | 10% | 10% | 10% | 10% | 10% |
See the "the Plan of receipt of money. The modeling of cash flows"
Planning the receipt of money
Delays in payment, payment by installments, changes in the cost of stages in the process of implementing long-term projects (or in the implementation of wholesale deliveries) are part of the financial planning risks that must be considered in the plans: "receipts of money" and "receivables".
In cyclical production there are no complex products and often the sales plan coincides with the plan for the receipt of money, but in cases where mutual settlements are made with delays of more than 1 month, there are receivables. The reason for this debt can be delays or installments payments. In the first and second cases, appropriate "schemes" of payments are planned.
Often the installments are planned in discrete models, e.g. in construction projects, where, as a rule, the funds are credited to the account, in fact sales can take months. Another issue in construction projects connected with the change of the estimated cost. Risks associated with the increase in the cost of the project (increase in prices of suppliers and contractors) that directly depend on the duration of the project – the longer the period of project implementation, the more likely it increase the risk.
Example of planning the receipt of money. Let, at reconstruction of a building for a business center, the company offers its customers standard products - "Mini offices". It is proposed to create several sales options in the "products" directory and calculate the cash flow (receipt of money) for the 1st year of the project.Company OOO "invest-Stroy", near the centre of town, bought and renovated a 2-storey building for accommodation of offices of class b (the"budget office"). Let the property ready for sale and lease 20 of the same products – mini offices (to simplify the example), total area 40 sq. m. Planned sales of the product:
- "Mini office" - long-term lease,
- "Mini office" with a 10% discount – prepayment 100%,
- "Mini office" (30% contribution) in installments over 6 months,
- "Mini office" (50% contribution) in installments over 8 months,
- "Mini office" (10% loan) installments over 12 months.
- the rental price is 5 500 RUB sq m/year
- the value of m – 55 000 rubles/sqm.
Let, the lease payments (conditions of contracts) shall accrue monthly and be performed at the end of each quarter – 3, 6, 9 and 12 months.
Product realization table:
| Conditions of sale of product | Volume of sales | Percent | Price sq m | Product price | Total | Schedule the start of sales |
| 1. "Mini office" - a long-term lease | 3 | 15% | 5 500 RUB sq m/year | 18 333 per month | 54 999 per month | 1, 2, 3 months |
| 2. "Mini office" with a 10% discount – prepayment 100% | 5 | 25% | 500 49 | 1 980 000 | 9 900 000 | 1, 1, 2, 3, 3 months |
| 3. "Mini office" (30% contribution) in installments over 6 months, | 4 | 20% | 55 000 | 2 200 000 | 8 800 000 | 1, 1, 2, 3 months |
| 4. "Mini office" (50% contribution) in installments over 8 months, | 3 | 15% | 55 000 | 2 200 000 | 6 600 000 | 2, 3, 4 months |
| 5. "Mini office" (10% loan) installments for 18 months | 5 | 25% | 500 60 | 2 420 000 | 12 100 000 | 1 month |
For planning cash flow, follow these steps:
- step. Create a directory of products (see table), and then – in the table "sales Plan",
- step. In the form of sales planning guide corresponding values of the quantity and value for each product (see table),
- step. Perform final calculation of the project: Main menu → Data → Calculate. The same thing - F9.
- step. Go to the "Income plan" and create payment plans: for rental payments (3rd, 6th, 9th and 12th months) and for installments - for 6, 8 and 12 months.
- step. Save the payment scheme (the "save" button) and copy it for other periods ("copy").
- step. Go to the "Set payment schemes" tab, select the product in the left list and link the "payment plan" in the right: just select the "payment scheme" from the list, as shown in the picture:
- step. Perform a trial calculation of the "Plan for the receipt of money" for one product: form Planning "receivables" → "Product list" → "Calculate" → «ОК».
- step. Finally, perform the final evaluation of the project (the"plan of receipt of money"): Main menu → Data → Calculate → To set the flag "flow of money" → «ОК». Same thing - F9 → To set the flag "sales plan" → «ОК».
 VAT is calculated and appears in the table of sales planning only after the final calculation (F9).
Pay attention, the "Sales Plan" indicates the price and quantity, the cost is calculated - the fact of sales, not payments, which are planned in the "Plan of receipt of money".
Example of planning of charges monthly lease payments:


To create payment schemes, go to the tab "settings payment schemes" and specify – what percentage (of the total payment) will be paid in the current and subsequent months:
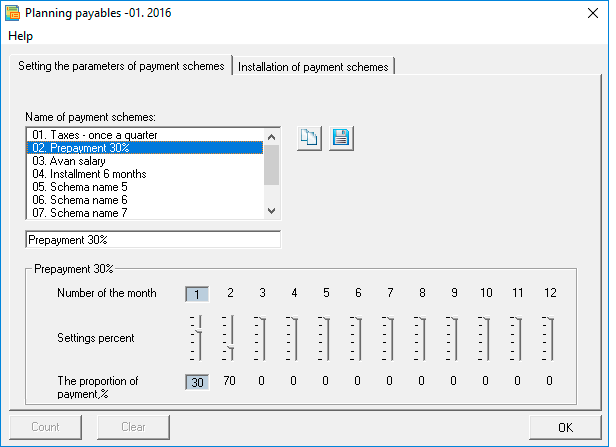
 "Payment plans" are created for 12 months of the project - for each month "own" scheme. For example, if the scheme is created for January, this means that all amounts that will be "tied" to this scheme and that are calculated in January will be paid according to the specified scheme.
You can create a "payment plan" in any month and copy it - for the remaining months. However, in some cases, the "payment scheme" depends on the specific month, for example, in the case of rental payments. In such cases, for each month you create your own "payment plan". See the example table for rental payments, where horizontally - "sales", vertically - "payment".
The table of "payment schemes" for rental payments - accruals and payments:
| Accrual months: | 1 | 2 | 3 | 4 | 5 | 6 | 7 | 8 | 9 | 10 | 11 | 12 |
| 1. Payment - January | 0% | |||||||||||
| 2. Payment - February | 0% | 0% | ||||||||||
| 3. Payment - March | 100% | 100% | 100% | |||||||||
| 4. Payment - April | 0% | |||||||||||
| 5. Payment - may | 0% | 0% | ||||||||||
| 6. Payment - may | 100% | 100% | 100% | |||||||||
| 7. Payment - July | 0% | |||||||||||
| 8. Payment - August | 0% | 0% | ||||||||||
| 9. Payment - September | 100% | 100% | 100% | |||||||||
| 10. Payment - October | 0% | |||||||||||
| 11. Payment - November | 0% | 0% | ||||||||||
| 12. Payment - December | 100% | 100% | 100% |
☛ Note that all accruals are paid at the end of each quarter. For example, the charges of 1, 2 and 3 months are 100% paid in March - exactly as it is formulated in this conditional example.
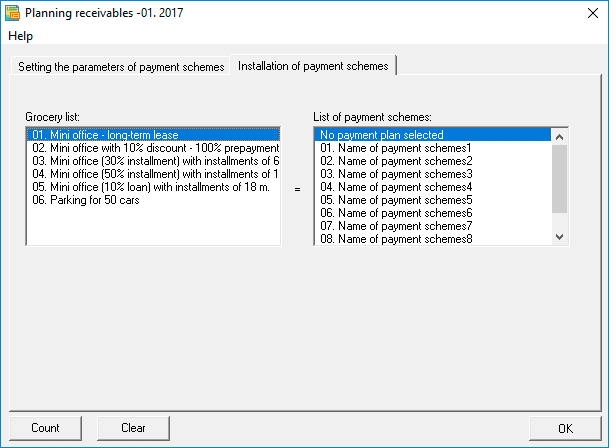
 If you do not choose payment scheme is the accrual and payment will coincide with the "sales plan" (after performing the final calculation of the project, F9).
The program also allows you to perform trial calculations - separately for each product. If you need to analyze the receipt of money for a particular product, first run the "clear the table" command (if it contains the previous calculations), then perform the calculation for one product.
Example 1. A fragment of the calculation of lease payments without using a "payment scheme":

Example 2. A fragment of the calculation of lease payments using the "payment scheme":

 "The plan of receipt of money" and "Plan receivables" are always calculated at the same time.
The result of the calculation is the cash flow (income) for the 1st year of the project:
| Months: | 1 | 2 | 3 | 4 | 5 | 6 | 7 | 8 | 9 | 10 | 11 | 12 | Итого |
| Accrual | 20478333 | 6416666 | 8414999 | 2254999 | 54 999 | 54 999 | 54 999 | 54 999 | 54 999 | 54 999 | 54 999 | 54 999 | 38004989 |
| Payments | 6248000 | 5324000 | 7875998 | 3608000 | 2662000 | 2826997 | 2046000 | 1738000 | 1616997 | 1298000 | 1144000 | 1616997 | 38004989 |
A fragment of the calculation of the "sales plan":

Fragment of calculation "Plan of receipt of money" - for the 1st year of the project,
where horizontally - "sales", vertically - "payment":
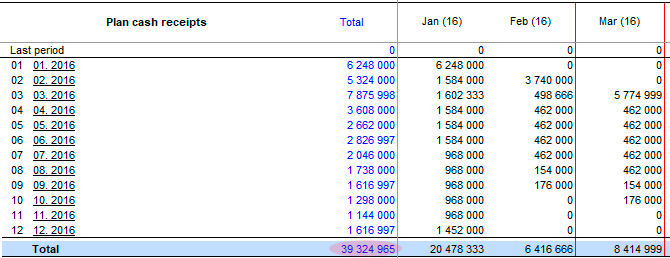
☛ Note that the final line of accruals in the "Plan of receipt of money" and the final line in the "Sales Plan" must be the same.
Planning direct costs
To plan direct costs in a cyclical model, go to the "Procurement Plan and Standard Costs". Here, in the form of planning, for each material (component), you must specify the following data:
- The standard consumption is the consumption per unit of output.
- Procurement schedule. If the schedule of purchases is not specified, the program itself will calculate the schedule - on the fact of sales.
- The insurance stock at the beginning of the project is a weighted average price (without VAT) and quantity.
- Planned stock of materials and components, in percents.
- The target price for each period.
For planning purchasing prices as in the price planning sales Budget-Plan Express uses special tools for adjustments and predict future prices – see "correct plans with the use of moving averages" and "Models of moving averages".
Planning of direct costs in non-cyclic projects using the example of a construction project
In non-cyclic projects (for example, construction), direct costs are planned directly in the Gantt chart, and for each stage, the cost and structure of the costs incurred at certain payment periods are taken into account.
☛ Note that the Gantt chart is created using the program interface, but if desired, it can be imported from MS Project.
For example, in construction projects using Gantt charts created to 70 percent or more of the calculated part of the business plan. And it is clear that the specifics of this data format allows to work only acyclic projects (construction, manufacturing unique products with a long production cycle, consulting, etc.).
Example of calculation of the production plan of construction of a 12-storey 3-sectional residential complex
Example. Calculation of the production plan for the construction of a 12-story 3-section residential complex.
To describe the production plan, use the Gantt chart (display of construction stages) and a table of "resources and production stages" (financial table of direct costs). In this case, the Gantt chart is not a financial table, but is used as an effective tool for editing and presenting data. In this example, it is planned to take into account the costs in the table with the "consolidated stages of construction", which resembles the "Consolidated Estimate Report", often used in the analysis of construction projects.
Let, the total usable area of 12-storey 3-sectional residential building 9753,12 sq. m. (36 one and two bedroom apartments ranging 38,71 and 67,51 sq. m., and 72 two-bedroom with an area of 82,35 sqm). It is proposed to build a schedule of construction works, calculate the cost of the stages. To calculate the table of the estimated cost of construction and installation works. To construct the analytical table the structure of the estimated costs to compare the cost structure with the average standards.
Before creating a Gantt chart, it is recommended to make a pivot table "Stages of the production plan" table to specify for each task (stage) timeline, baseline cost, specification of costs formation. Table can be viewed in a detailed example: "planning construction of a 12-storey 3-sectional residential complex" in section "cost Planning "for the implementation of production phases"".
On the "Directories" page, create a directory of "resources and production steps", or import from a dynamic named range, if already created.
Example directory "resources and production stages"

In summing lines, you need to specify the corresponding property ("sum" or "total").
The "Type" column indicates one of three cost types: "Material", "Labor" or "Other". In our case, all the rows indicate the cost type 'other', as the cost of the stages includes material and labor costs. In small projects (for example, the construction of cottages), costs can be identified by cost groups, in large projects, cost-sharing by groups is not appropriate.
In the column "VAT" the tax percentage is set by default (in the settings). Also, it may be set incomplete VAT, for example, when the work is performed by our own construction crews. In this case, we need to calculate the VAT in the cost stage. For example, if the value of "interior trim" includes the cost of the work is 30% (done on their own, without VAT) and the cost of the materials – 70%, in this case, you must specify a VAT of 12.6% (18% x 0.7 = 12.6 percent) .
After the directory is created, you need to create the corresponding table "Cost plan for the implementation of production stages" from the main menu: "Data → Create table → Plan resource costs", as shown in the figure.

Creating a Gantt chart.
The next step is to create a Gantt chart (or imported from MS Project). The amount of phases (tasks) and cost items are added to the edit window, you can optionally specify the order of financing stage ("In the beginning", "Proportional", "after").
Gantt chart "Project to build a 12-storey 3-section apartment house". Budget-Plan Express
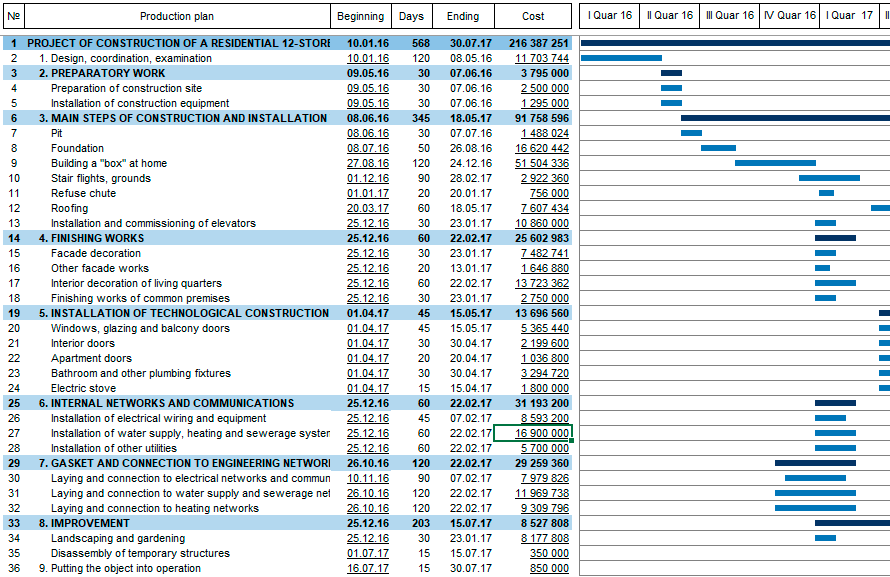
After editing the Gantt chart, perform the final calculation. The final calculation is performed from the main menu: "Data → Calculate → "Gantt chart"". Also the F9.
Fragment of the calculation of the table "Cost plan for the implementation of production stages"
(the cost structure is defined by the directory of "consolidated stages"):

☛ Note that the description of a business plan construction using Gantt charts that are linked to her cost structure is the fastest and most effective way to develop financial table. The reason is that using the Gantt chart, not only important milestones are described, but almost all construction costs, with the exception of some costs: land (from 6 to 15% of construction costs), credit load (about 10-15%), marketing (3-10%), the contents of the device (3-8%).
The analysis of this example shows according to the cost structure of the average Russian indicators, including the cost of construction of 1 sq. m, which is 29 990 rubles (cost of the project = 292 491 496, total utility area = 9753,12, the cost of construction = 292 491 496 / 9753,12 = 29 990), note, the national average is 25-30 thousand rubles.
Also, it is useful to analyze the structure of construction and Assembly works, which account, according to various estimates, from 60 to 75 % of the cost of construction. Also, "inside" construction works there are more and less costly articles, which can be compared with the average standards or with the model in the same project.
The cost structure is "inside" construction and installation works:
| The structure of costs "inside" construction and installation works: | Amount | % |
| Preparatory work | 3 795 000 | 2,2 |
| Foundation | 18 108 466 | 10,3 |
| "Box" | 51 504 336 | 29,4 |
| stairways, platforms, chutes | 3 678 360 | 2,1 |
| the Installation of roof | 7 607 434 | 4,3 |
| Installation of elevators | 10 860 000 | 6,2 |
| Internal networks and communications | 31 193 200 | 17,8 |
| Finish | 30 169 922 | 17,2 |
| Facades | 9 129 621 | 5,2 |
| Improvement | 8 527 808 | 4,9 |
| Putting the object into operation | 850 000 | 0,5 |
| TOTAL | 175 424 147 | 100,0 |
☛ Note that the analysis of the estimated costs by type of work, the technique used, by materials, taxes, etc., would be useful, for example, for a certain stage of construction in order to optimize cost management. At the same time, such an analysis, including all stages of construction and installation work, most likely would not make any practical sense from the point of view of planning and analysis of the cost structure.
Data analysis, financial tables and conclusions, as a rule, are accompanied by graphic visualization. There are two types of graphical representation of data: dynamic (horizontal) and structural (vertical).
The program includes standard modifications of graphs (about 70 modifications) of three types: "line", "histogram" and "circle". In our case, to create a graph that displays the data structure, you need to select a "histogram" or "circle".
To graph, you need to select the appropriate piece of data (in our case, a total column and all the costs of "construction work"), then select the type of graph: "Main menu → Reports → Histogram".
Construction and installation work. Cost structure:


In the graphics editor of the program, you can change the modification of the graph in the menu item "Chart settings". Also, you can save the graph in raster formats (GIF or JPG) for later insertion into a text editor Word, PowerPoint, etc. See details in the section "Preparation of reports and business plans. Charts".
☛ Note that the data can be transferred to Excel and build graphics there.
Read more the example you can see in "cost Planning "for the implementation of production phases"".
Also note, to account for the capitalization of costs, for example, in construction projects, use a special interface with the edit form, where must be checked "investments in non-current assets". After the appropriate settings and run the balance calculation, the costs will be included in the final asset value cumulative up to the period of the "object input in operation", where they will be charged on sales. See more "Example of capitalization of costs (included in non-current assets value)". See also – "Why in the program all costs, including targeted financing, are included in the "Profit and Loss statement"?".
The acquisition and disposal of non-depreciable assets. Other associated costs
In the planning stages of construction, a large part of the cost (typically more than 90 % of the costs) are described in the Gantt chart. However, it is impossible and not correct to display all construction costs in the Gantt chart.
In the "Cost Plan for the implementation of production stages," the following costs are not taken into account:
-
1. Registration of property rights to land and buildings;
2. Marketing and other commercial services;
3. The contents of the machine Builder and other administrative services;
4. Credit load and other related costs;
5. Other associated costs.
These categories of costs are calculated in other plans. For example, the cost of "registration of property rights to land and the construction of" logical to describe in assets. See the "Example of an acquisition and write-off of non-depreciable assets".
The cost of "marketing and other business services" are usually described in terms of "fixed costs", credit load and other related costs associated with attracting credit resources in the "Financial plan" ("Credit products", "Operating and financial leases", "Reserves of forthcoming expenses" and "Placed equity instruments").
☛ Also, note that "other related costs" in the structure of costs for the construction of an apartment building are reflected in the periods of direct implementation of the project stages. For example, the project calculation period, including investment analysis, is 3 years (36 months), but the implementation of the construction stages, before commercial sales - 14 months. That is, in the summary table of the cost structure, the "other associated costs" are most logical to display in the periods from 1 to 14 months (14 months) of the project implementation.
Planning fixed costs
Planning of fixed costs it is recommended to start after completion of the planning of all major operating plans. Table contents should be verified and should reflect the basic structure of the fixed costs. These tables generally structured for various segments, depending on the planning purposes. In planning, the ordering of the data is called "data segmentation". The maximum number of records to "30". If necessary, you can use the aggregated data.
The following drawings by the example of advertising expenses (line 21), demonstrate – how to avoid excessive detail data:

In this example, the plan of advertising expenses (line 21) reflects the contents of the final row in the table below.
An example of a table – breakdown of plan expenses on advertising:

It is recommended, prior to planning, to write a table - a technical task, which would reflect the structure of fixed costs, corresponding to the objectives of the analysis for your business plan.
Example. Worksheet for planning fixed costs.
Suppose a business plan scenario. A small workshop for the production of cheese. The company uses a simplified tax system (6% of revenue). Start of production is scheduled for 2018. Wages will grow gradually, the first year - every 6 months, in the future - from the beginning of each year. The rental price is 70,000 at the beginning of the year, and every 6 months - an increase of 2%. The Sales Officer will start work from the beginning of the 2nd year of the project. Own position of an accountant is not provided, it is assumed to be outsourced.
Here’s how a cost table could look like in this case:
| № | Name of fixed costs | 2018 (1-6) | 2018 (7-12) | 2019 | 2020 |
| 1 | Director | 20 000 | 30 000(+10000) | 50 000 | 60 000 |
| 2 | Secretary | 20 000 | 30 000(+10000) | 32 000 | 35 000 |
| 3 | Production technologist | 20 000 | 30 000(+10000) | 40 000 | 45 000 |
| 4 | Total management personnel | 60 000 | 90 000 | 122 000 | 140 000 |
| 5 | Working [2] | 40 000 | 50 000(+10000) | 60 000 | 60 000 |
| 6 | Driver | 30 000 | 35 000(+5000) | 40 000 | 40 000 |
| 7 | Other employees | 20 000 | 25 000(+5000) | 30 000 | 30 000 |
| 8 | Total Executive staff | 90 000 | 110 000 | 130 000 | 130 000 |
| 9 | Room rental | 70 000 | + 2% each. 6 m. | - | - |
| 10 | Transport cost | 30 000 | +5% per year | - | - |
| 11 | Utility costs | 12 000 | +5% per year | - | - |
| 12 | Accounting expenses (outsourcing) | 5 500 | 5 500 | 5 500 | 5 500 |
| 13 | Other expenses | 10 000 | 10 000 | 10 000 | 10 000 |
| 14 | Total administrative expenses | 127 500 | - | - | - |
| 15 | Sales Officer | 0 | 0 | 40 000 | 45 000 |
| 16 | Internet advertising, other advertising | 30 000 | 30 000 | 35 000 | 40 000 |
| 17 | Other expenses | 10 000 | 10 000 | 10 000 | 10 000 |
| 18 | Total selling expenses | 40 000 | 40 000 | 85 000 | 95 000 |
| 19 | Total | 317 500 | - | - | - |
It is convenient to use data from this table both for planning (in the program) and inserting it into the text of a business plan, when describing, for example, the staffing table.
Example table - shares (percentages) of products in operating profit and direct costs.
Percentages are used to allocate fixed product costs. If you use the ABC-method (Activity Based Costing) - a method of posting indirect (fixed) costs, simply use these percentages in the form of editing fixed costs (tab "exploding costs"). You can also, for posting product costs, use interest calculated from operating profit or from the ratio of direct costs.
| № | Product name | Operating profit | Direct costs | ||
| Rubles | % | Rubles | % | ||
| 1 | Cheese firm "Russian new" | 60 369 900 | 59% | 34 596 340 | 58% |
| 2 | Cheese pickle "Adygei" | 25 894 720 | 25% | 16 060 731 | 27% |
| 3 | Cottage cheese "Classic" | 15 720 300 | 16% | 9 111 149 | 15% |
| 4 | Total | 101 984 920 | 100% | 59 768 220 | 100% |
And, after editing, fixed costs will be included in the cost of products - in accordance with the specified shares (percent).
☛ In the future, these settings (cost distribution) will be used when calculating reports on products and when performing break-even analysis (Break-Even Analysis).
For more information, see "Plan fixed costs. Practical planning".
Planning of sources of financing of the project
After editing the operating plans and preliminary calculations of the business plan, as a rule, the "Report on cash flows" there is a shortage of funds in the summary line. Maybe the deficit can be eliminated if the to attract "credit resources" or "rental products" (financial or operating lease), "investment" or other funding sources.
In some cases, it is not advisable to consider additional sources of financing, and in such cases it is said that the project is "not profitable", "with negative profitability" or "unprofitable".
In the process of developing financial plans, various tasks are being solved to model the optimal ratio in the capital structure of borrowed and own funds, the task of covering the cash deficit, especially in the initial stages of planning, and others. This approach to building a financial model of the project is called "simulation" or "situational" modeling.
Elimination of cash deficits or temporary "cash gaps"
At the final stages of the planning, in the final line of the "Cash flow" report, negative values may appear, meaning a cash deficit or a cash deficit, that is, a shortage of funds needed to finance the next incoming expenses . Unlike the current production gap, a temporary financial gap can be predicted.
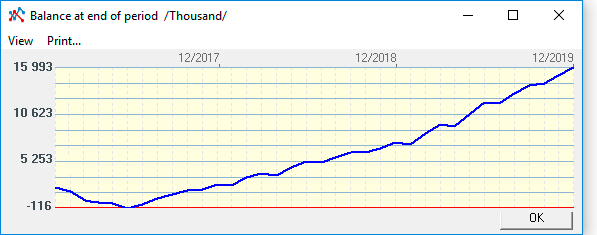
The cash deficit is displayed in the line (Cash flow) "balance at the end of the period"
(right click):
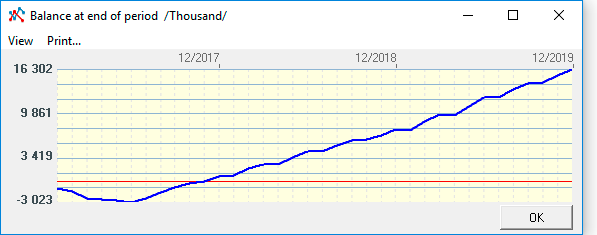
☛ Notice, the graph "sank" into the negative zone in a limited space. If the schedule had been in the negative zone in the last periods, it would have nothing to do with the cash gap, but would refer to the "project budget deficit", and in this case the project would be unprofitable (unviable).
As can be seen on the graph, the maximum deficit of cash is 6 months, and is 3,024 thousand (3 million 24 thousand). One of the options for eliminating the cash deficit is the attraction of credit resources in the financial plan.
The result of attracting credit resources is displayed on the graph - line
"balance at the end of the period":
See the example in section "The elimination of the deficit of funds, the closing cash gaps".
Project analysis, preparation of reports and business plans
Break-even analysis
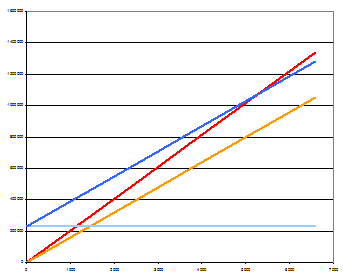
The program will create an Excel file, in which it will build a break-even table and break-even point chart for the selected period. The break-even analysis procedure is called from the main menu: "Main menu → Reports → Export to Excel → Detailed reports". Then a window will appear on the screen in which you need to select the period: year, quarter or a specific month.
As a result, the program created an Excel file with two pages: "Break-even schedule" (see figure) and "Break-even table".
Break-even schedule:
See the example in section "Report on the products. Break-even analysis".
Financial (ratio) analysis
Coefficient analysis is aimed at reflecting the picture of the financial condition of the company by some standard coefficients. This section of the standard analysis of the business plan of the project (the company's budget plan) is called a financial or "coefficient" analysis.
To calculate the financial and economic indicators, you need to perform common calculation: Main menu → "Data → Calculate" – select from the list of calculation "Financial analysis" (the same: F9).
Analysis based on financial ratios (ratio analysis) allows to investigate the financial condition, results of operations and investment capacity of the organization, and includes the following groups of indicators:liquidity indicators (Liquidity Ratios), indicators of debt management (Debt ratios), profitability (Profitability ratios), efficiency ratios (Asset management ratios) и indicators of market activity (Market value ratios).
For details, see the sections "Financial analysis. Ratio analysis" and "General settings. Financial analysis".
Investment analysis
Investment analysis is an important final part of the business plan. In the investment analysis apply methods for evaluating the effectiveness of projects developed for calculations of the main indicators of economic efficiency of investments. Budget-Plan Express offers a fairly open architecture settings performance indicators. However, the possibility of universal settings interested, most likely, the small circle of professionals who would, in special cases, to obtain a more in-depth investment analysis with full understanding that the program will be considered.
☛ Note, detailed planning horizon in the program for up to 36 months. As a rule, the vast majority of projects are planned in the horizon up to 3 years (36 months). However, to calculate the project payback and other integral indicators, the calculation period can be extended to 15 years (180 months).
Budget-Plan Express to calculate all key performance indicators investment:
- payback period – PB, months;
- discounted payback period – DPB, months;
- net discounted (present) income – NPV;
- profitability index – PI;
- internal rate of return – IRR, %;
- average rate of return - ARR, %;
- modified internal rate of return – MIRR, %;
- other indicators based on the data calculated in the program.
Discounted cash flows are calculated by the formula, reverse the complex rent, by default - postnumerando (at the end of the period). Thus, all cash flows, including initial investments, are actually discounted from the second month of the project - as it should be (if the parameter "prenumerando" or the step of discounting "year" is not set).
To reduce the impact of discounting on initial investments, set the discounting step in the settings to "month" (possible step settings are "month", "quarter", "year"). This is logical, since the influence of discounting in this case will increase gradually - from month to month.
If the initial investment is made before the beginning of the month of calculation (the index of the month specified in the settings), they, along with other cash flows, are not discounted (see the NPV calculation example).
Example calculation NPV, postnumerando, with a discount rate of 5%:
| n | Cash flow | Initial investment | discount Factor | CF (1+r)t | NPV |
| CF | I | (1+r)-t | |||
| 0 | 0 | 80 | 1,00 | -80 | -80 |
| 1 | 0 | 70 | 0,95 | -67 | -147 |
| 2 | 0 | 0 | 0,91 | 0 | -147 |
| 3 | 50 | 0 | 0,86 | 43 | -103 |
| 4 | 50 | 0 | 0,82 | 41 | -62 |
| 5 | 50 | 0 | 0,78 | 39 | -23 |
| 6 | 50 | 0 | 0,75 | 37 | 14 |
| 7 | 50 | 0 | 0,71 | 36 | 50 |

In fact, in order to eliminate incorrect results, in the calculation of NPV, total investments are compared with the accumulated cash flow.
Information, refer to section "Indicators of efficiency of investments". See also calculation "the economic profit measure EVA (Economic Value Added) and other complex indicators". Change the settings in the section "General settings. Investment analysis".
Preparation of reports and business plans
After planning is complete, it is time to begin to prepare the reports of the future business plan, including in text editor Word.
To prepare the report in Word, you need to call in a special form, where you specify the export parameters of the future business plan. For full press export, execute the menu item: "Main menu → Reports → "to Create a report in Word"".
In "Budget-Plan Express", the process of creating business plans in Word is maximally automated. At the first stage, a document is created in Word, where the marked tables are exported - in the currency selected by the user and in the language (Russian, English) that the user chose. At the same time, the business plan is a "free" report, not limited to the standards, and includes a whole range of materials and illustrations - analytical text, conclusions, table fragments, graphs, risk analysis, variant analysis, etc.
If different languages are used for reports (Russian, English, "user" language), you first need to translate table texts using a special procedure "Translit".
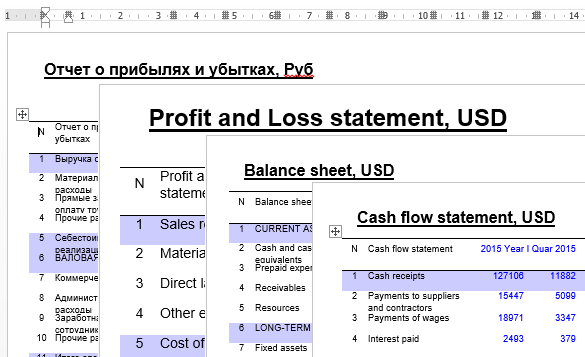
Graphics are an important part of the financial statements and business plans. Graphics inserted into the text, or they accompany the tables and announcements in the presentations. "Appropriate" graphics add value to any business plan or analytical material.
To save the graph, select the menu item "Save graph", then, in the dialog box, select the path (default – directory "files"), specify the name and the file type is one of the extensions (. GIF or. JPG), and click Save. The saved graphic file can be inserted into reports in Word, PowerPoint, etc.
Information, refer to section "Preparation of reports and business plans. Reports in Word". See also: "fast" graphics and export plans to Excel.
